Hi, Tracker fans!
Do you ever have conversations with folks you work with about where a story is deployed?
“The story says it’s delivered but it doesn’t look like it made it to our demo server…”
“Did that bug fix make it to production yet so we can let our customers know?”
“Is that chore you were working on in prod yet? I think it might be causing some performance issues…”
In the category of “solve your own problems,” I hacked up a prototype for answering these questions automatically, right within the tool that I love, Pivotal Tracker.
Here’s how I did it—and how you can, too!
To make this magic happen, I needed a few things
- Tracker story IDs in my source control commits
- Data aggregating the associations between those stories and commits in one place where a browser can get a hold of it
- A way of updating the contents of my Tracker stories page to display the information
Here’s how I went about addressing each one of those requirements.
Step 1. Getting Tracker Story IDs
If you are familiar with Tracker’s GitHub integration, then you might not have to do anything! Just tag your stories with the Tracker story ID in your commit messages like so:
[#1234567] This will align the planets and bring them into universal harmony
The Tracker team already uses this integration, so there was nothing I needed to do here. :)
Step 2. Bringing all the data together
To understand which stories had code deployed, I looked to our automated deploy process. At the time of deployment, I know the environment being deployed to and the SHA of the commit being deployed.
I wrote a small ruby script to look at the commit messages and extract the story IDs. After that’s done, the results are written to a file and then put in a place where the browser can get access to it.
We used Google Cloud Storage, but you could just as easily use AWS buckets or some place on your own site where public assets are hosted.
It is less than ideal to store these items out in public, but the only data exposed are Tracker story IDs and commit SHAs. The output looks like this.
{
  "88627512": ["1d9ffed9f05bdd57db3717130360399454ac4d6d"],
  "89022662": ["9fa6146daea00e94c42e1a41244f7ccbc4f6b6f6"],
  "88194412": [
    "b1a5f998af78cbe921ed443085b0a5cb6df20147",
    "6cb993340bcce0167523a8a517dcc6a8e821361e"
  ],
  "89051494": ["d7fa5db9de1e2d41d30fc7d7e466b804dda6d044"]
}
I wasn’t quite ready to integrate this into the actual Tracker product, so I managed to get the information into Tracker by creating a Chrome extension called Deploy Spy. Once Deploy Spy is installed into Chrome, you right-click on the icon and go to Options. For each environment, your stories can be deployed to just provide the name of the environment and the URL where the data lives from Step 2.

Install Deploy Spy Now
There’s also an option to import a JSON file with your configuration, so you don’t have to type it each time you install it on a new machine. After configuring it, just refresh your browser so the extension can pick up the latest data.
Voilà!
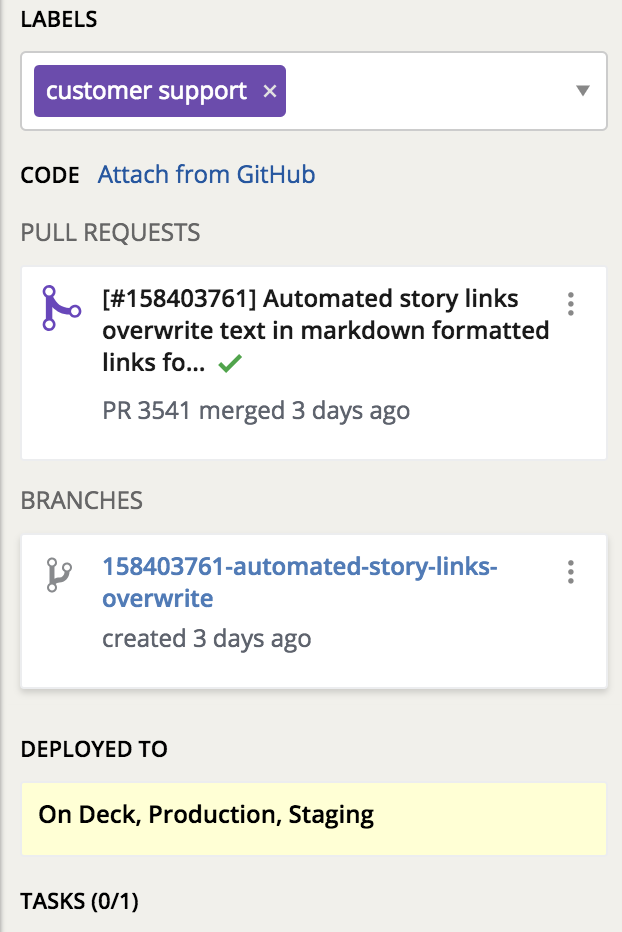
Once it was all wired up, here’s what I had!

You can do it, too!
All the ingredients are there if you want to give this a try for yourself. Let me know in the comments if you try it out or if you need any help! There are more detailed instructions in the Deploy Spy GitHub repository.