Many cultures have the ritual of spring cleaning, a deep clean to get areas that aren’t normally covered—scouring the oven, dusting the blinds, and getting rid of your old junk. At Pivotal Tracker, we decided to do a little spring cleaning in our code base to kick off 2016.

Projects that have been in production for many years like Pivotal Tracker can accumulate dead code over time, especially when we do refactors and don’t know what to delete. In addition, as team members leave, we lose knowledge of which files are important and code that may not be used anymore. For these reasons, the Tracker team felt that our codebase had some dead code hiding behind the fridge, and we wanted to clear it out. But how to find it?
Of course, we hoped to reach for a tool to help identify what to delete in our almost 200k lines of just front-end code. We first turned to Webpack to see which files weren’t getting required into our compiled build, but that didn’t help us as we were requiring dead code.
How about using a code coverage tool? The normal use case for code coverage tools is to see how much of your codebase has been tested, but that really wasn’t what we wanted considering that we do all testing all the time at Pivotal. We wanted to know which lines of our code got run when people actually used our app. Ideally, if we could perform every functionality that our app offers, we should see every line in our codebase get used, besides any dead code. In actuality, this is neither practical nor achievable (think error-handling paths).
In order to get what we wanted, we planned on “instrumenting” all of our source code with the istanbul.js function wrappers, then running just our browser UI tests, which would hopefully run close to all our features. The tricky part was making it work with code that was being compiled and concatenated through Webpack (from ES6).
Here are the steps we took:
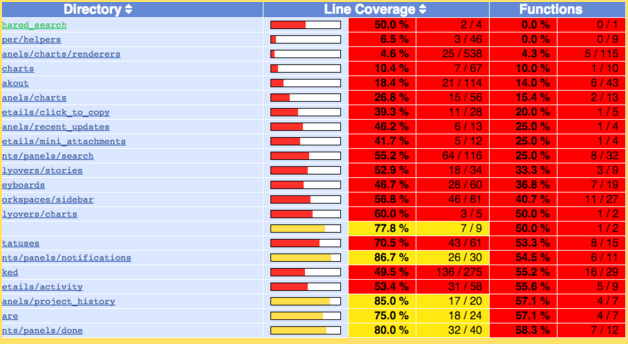
Our approach worked very well, and we found lots of files with code that didn’t get called. The question was, how many of the red files actually contained dead code?

Often, the unused code was in the error-handling side of a code branch, in a fallback for unsupported browsers or loss of connectivity, or in some cases, a path that our UI tests never ran.
Through a process of manual iterative filtering, we identified a list of files and functions that seemed unnecessary, and could finally start obliterating dead code.

It turned out we were a lot better off than we thought. We did find some dead code, and a few hidden easter eggs, too. In the end, we only removed 59 unit tests and 1,242 lines of source code, not quite 1% of our codebase.
We hypothesized that a lot of “tribal” knowledge would get lost when members had left, but—perhaps through our pairing process and test-driven development—we knew what to delete when it was time to refactor.
Was it worth it? Would we do it again and use the same process? Although we didn’t find as many burnt, crispy code bits splattered on the back of the microwave as we anticipated, we feel better knowing that we don’t have dead code gumming up the works. We will probably do this process again next time we want a thorough cleaning.
Up next, perhaps a spring training round with a code-quality tool to beef up and shed a few unnecessary pounds.
Note: This article was cowritten by Jeff Schomay and Tom Osugi.
Category: Productivity
Tags: Engineering How to