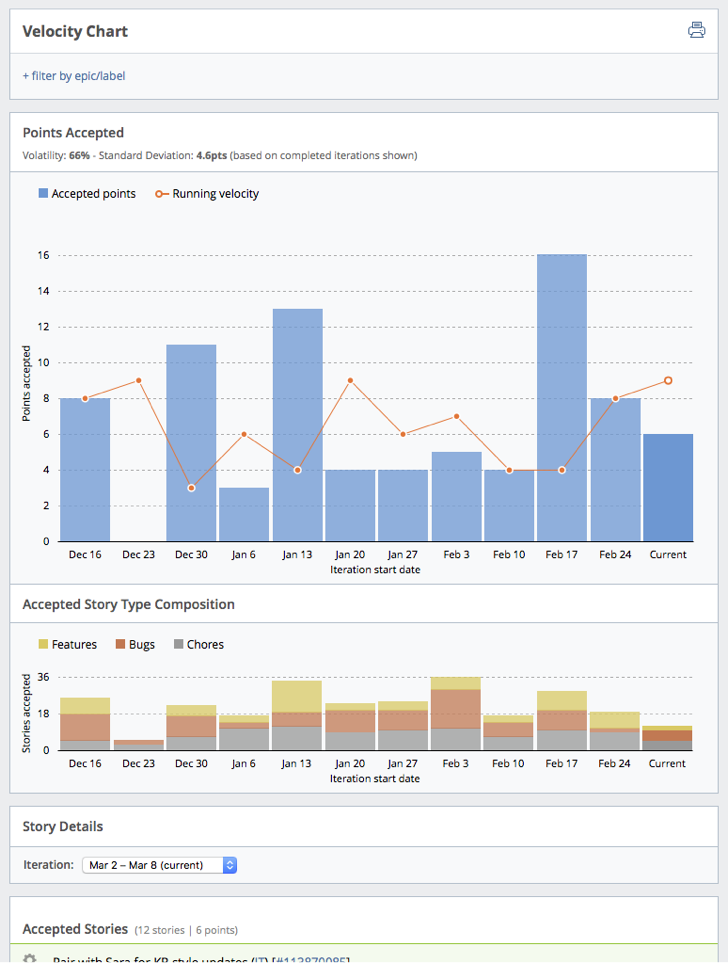
The Velocity chart shows the number of accepted points (by story type) and the running velocity for the last 12 iterations, including the current iteration.

You can use it to reconcile velocity changes; an increase in accepted bugs or chores can explain a dip in velocity. It’s also helpful for managing technical debt: keeping chores at a steady level ensures a focus on keeping your systems and code in peak condition. There are several things you can do with this chart:
-
Monitor overall project health. The Velocity chart visualizes a number of project trends: iteration velocity (including average velocity), accepted stories by type, and volatility metrics. This makes the Velocity chart an ideal gut check for overall project health.
-
Understand velocity trends. Accepted points may be low for a particular iteration when there is a large number of bugs, chores, or zero-point stories. The Velocity chart makes these “bug/chore walls” visible by showing iteration velocity dips alongside an increase in accepted bugs.
-
Track volatility. Volatility is a relative measure of predictability. Frequent velocity peaks and valleys may imply an unpredictable project, whereas smoother iteration-by-iteration velocity suggests a more predictable one.
The bars show Accepted points (i.e., the total number of points for accepted stories in each of the most recent 12 iterations).
The line shows the Running velocity (i.e., the calculated velocity for each iteration).
The Accepted Story Type Composition is a breakdown by story type of the number of accepted stories for each of the displayed iterations.
See Understanding velocity for information on how Tracker calculates velocity, and how project owners can help ensure an accurate reflection of work completed in each iteration.
Using this report
Click view report to the right of Velocity and Points accepted on the Project Overview chart.
Mouse over any bar in the charts to display a breakdown for each iteration.
To see the data for just an epic or label, click + filter by epic/label, type the first few letters of the epic or label name, and then select the one you want. One epic/label filter can be applied at a time, allowing you to drill down into a specific feature.
To see story activity for any iteration within the last six months, click on a bar in either chart or choose an Iteration in the Story Details report.
Mouse over initials to see someone’s full name, and click the story ID to open the full-page view of that story.