
The Iteration report is a big-picture overview of the progress made in a specific iteration. You can see the day-to-day pace in terms of story acceptance or stories added to scope, how progress compares to the previous iteration, and how the overall project health indicators were impacted, such as a cycle time increase in an iteration.
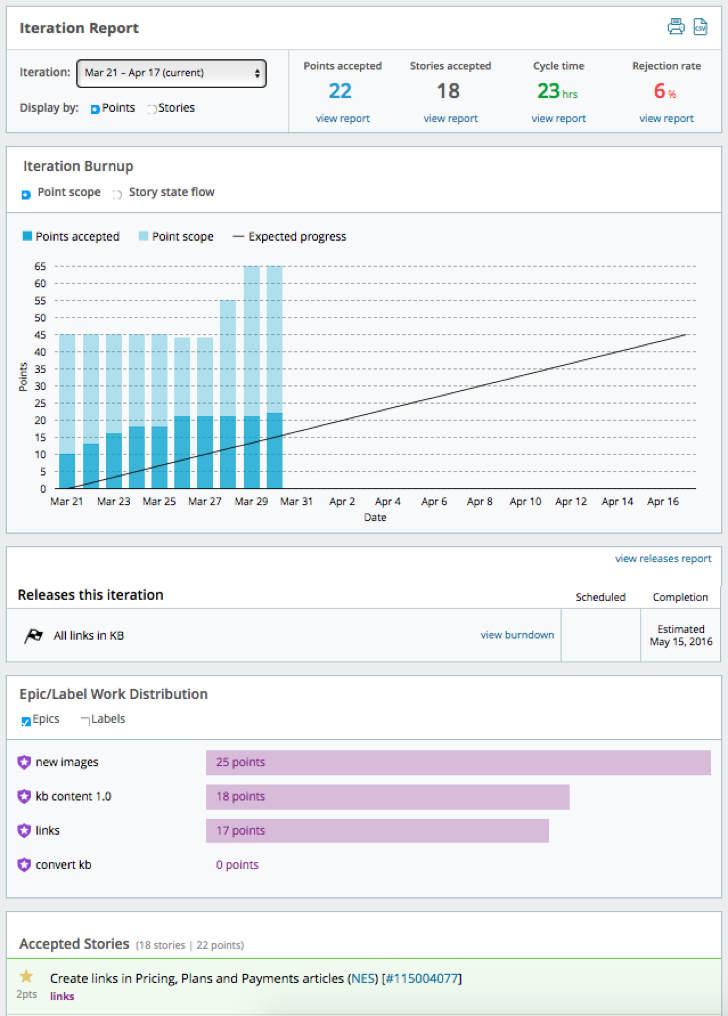
The iteration report also shows how much progress was made toward the next release, as well as in-progress epics. You can see how the team’s work distributes across epics, and view a list of in-progress stories from this iteration.
There are several things you can do with this chart:
-
See an overview of progress made in a given iteration (current is the default).
-
Find out how the team impacted the numbers—did they get more done this iteration than the previous one? Did cycle time go up or down?
-
Visualize day-to-day pace within each iteration via the embedded burnup and state flow diagram, and compare to the “ideal pace.”
-
Investigate any mid-iteration point scope increase.
-
See how much progress was made during this iteration toward the completion of the next release and/or in-progress epics.
-
See which epics and labels had the most work done on them.
-
Get story-level detail on what was started, finished, accepted, etc.
Using this report
Click Iteration in the Analytics sidebar.
Choose which iteration to report on, and get more details by clicking view report by each of the numbers and releases displayed.
Select whether to show point or story counts in the Burnup chart, and either scope or story state flow.
Mouse over the chart to reveal the number of points accepted and scoped on each date.
Filter by Epic/Label Work Distribution to just see epics or labels.
In the stories lists, mouse over initials to see someone’s full name, and click the story ID to open the full-page view of that story.