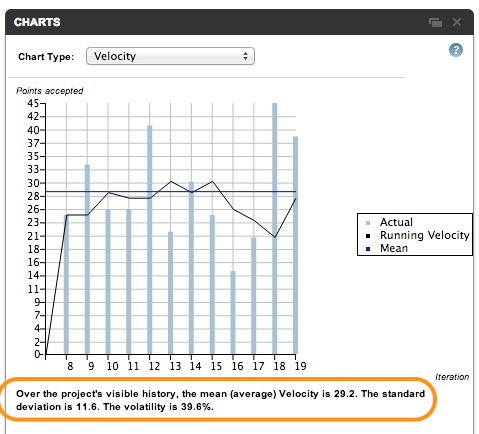
Volatility is what Pivotal Tracker uses to measure the consistency of your team’s work output. You can use that number to help you estimate the first approximation to answer the eternal question, “Will I make the deadline?”
One fine day at the office…

You’ve scoped out 100 points worth of stories for the Next Big Release™. Pivotal Tracker shows your velocity is 10 points per week. Your annual review is in 3 months and on-time delivery of this high profile project will figure prominently.

Then the CEO walks over to your desk and asks, “Will I make the launch date, 10 weeks from now?”
What do you say?
- “Yes, my lord. Of course we’ll make our date! I’m 100% certain of it; Behold; Tracker says we’ll finish in 10 parsecs.”
- “Probably; We had some iterations that cleared 30 points, but last week we were working on bugs and only accepted 2 points. A couple weeks of those and we might miss the deadline.
- “There’s no clear answer. There are so many other uncertainties, technical debt, QA, deployment work.”
It’s a trap!

Velocity, week over week, varies; sometimes a lot, sometimes a little. It depends on the project. Ideally, each iteration would have the same mix of stories, bugs and chores and Velocity would be very consistent. Steady velocity is a good thing™. In the real world, however, all sorts of things crop up; Your head-count goes up (or down), business priorities shift (or pivot), deferred technical debt demands payment, quality assurance files a slew of bug reports, user testing reveals flaws in product, visual design changes. The real world creates volatility in your Velocity.
A simple measure of this is standard deviation, which Tracker constantly computes for your project. Using that metric, you can decide what you should watch or change in order to meet your goals. Let’s go back to our example and look at the velocity charts in Tracker.

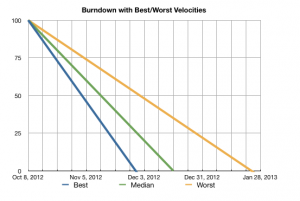
Assuming that we have a normal distribution of weekly velocities, the first sigma (±35%) will fall into the range of 10±3.5 points each week. That is, there is a 70% probability that your project will deliver all 100 points somewhere between 8 and 16 weeks. Why so much spread? 40% volatility is a big number! In the worst case scenario, where every iteration delivers only 6.5 points, it gets you to your goal in 100 ÷ 6.5 ≅ 16 weeks.

I Find Your Lack of Faith Disturbing
By now, you’ve had your meeting with the CEO. You’ve shown him the stories left in the backlog, the volatility of the project, and the range of estimates for delivery. This is the beginning of a conversation. If you’re team is not comfortable with the worst case scenario, something must change and, really, you have only two choices; you can reduce volatility or you can reduce scope. You will probably need to do both. Alas, there is no simple formula here. This is where skill, experience and insight will come into play. Here are some suggestions:
Reduce Volatility
- It’s critical that stories are accepted as soon as possible after they are delivered. Is the project manager unable to accept stores as they are delivered, so they don’t get credited in the iteration where they started? You can backdate acceptance to reflect when the stories were ready (rather than when the PM accepted them), but it is not something I would do on a regular basis.
- Are the stories marked as bugs and chores truly overhead, or are they “stealth” features? Does the story add business value to the product? That’s a feature. Flaws introduced by feature stories are bugs. Design changes surfaced by testing is a new feature.
- Are there too many stories in flight? Can you deliver stories more reliably by starting fewer at a time? Study after study shows that human beings do not multitask well at all. Do one thing, do it well, then move on.
- Are there blocked tracks? Do stories get stalled because of dependencies? Can you reorganize your backlog so each story is independent.
- Are there outside resources, out of your control, that are introducing volatility?
- Multiple rejected stories are toxic. If your team is getting more than one or two rejects each week, this may be a sign that your stories are not accurately representing what your product manager intended. It’s time to look at your work flow to prevent them from happening so often.
- Are you not refactoring enough? Constant, steady refactoring, delivered during each story is much better than giant refactors that last a week. You should consider refactoring as critical to your process and not something to do “later, when you have more time for it.”
- Make all of your projects small by breaking them up. Delivering a project on time is always tricky business. I’ve discovered that it is actually easier to work on projects with short time-lines (6 weeks seems to be a good number). Urgency and a looming dead-line focuses the mind in wonderful ways.
- As a tactical measure, simplify your pointing strategy. Pivotal Tracker offers many pointing “styles;” linear, quadratic, fibonacci, or you can customize your own. Try going simpler (instead of finer granularity); a 0-1-2-3 scale (easy, medium and hard), might give you a more accurate picture.
Reduce Scope
- What’s really at risk if you miss the deadline? Often, the perceived urgency is far greater than the actual risk to the project.
- Are there features that you can jettison?
- Are there features that you can defer?
- Are you spending too much time on “pixel-perfect fidelity?” Talk to your designers; look for ways to reduce complexity. One good way to reduce complexity is to lean more heavily on standard user interface libraries (which might affect the unique visual design of the project).
- Can you make “soft releases” where you deliver fewer features, earlier, to reduce risk?
- Look at your project goals again. Are the stories in the backlog truly delivering features that will meet your goals?
- Are there parallel “tracks” that allow you to add man-power to the project (but see below).
Watch for Icebergs
- Do you need to stand up a new production environment? That will take time. It’s a point-able story. Make sure that all the necessary steps to release are in the budget.
- Are you refactoring as you go? Have you been postponing technical debt? Those interest payments will start to pile up as you get closer to release time. Make sure you and your team know that keeping the code clean is an essential part of every story.
- Anything that changes your team will change both Volatility and Velocity. Are you adding a new team member? (Remember Brook’s Law: “Adding manpower to a late software project makes it later.”) Vacations, holidays, sick days and babies will affect your velocity. Remember to account for it in Tracker.
You’re all clear, kid, now let’s blow this thing and go home!
This article should give you a lot to think about. Good project management is hard work. When projects are just getting started, everything feels fine, and later you start to wonder when everything went to hell. Remember, volatility kills.
Notes
- velocity
- Just like a speedometer that measures how fast you’re hurtling through space, Tracker’s velocity is a measurement of how fast your team completes stories. Instead of miles or kilometers per hour, Tracker expresses velocity as the number of points completed per iteration (normally a week). Because Tracker stories are assigned point values instead of due dates, Tracker calculates velocity by averaging the number of points you’ve completed over the past few iterations. In Tracker, past predicts future.
- volatility
- Mathematically, Volatility isStandard Deviation ÷ Mean Velocity
- acceptance
- If stories languish in the accept/reject state (a field of red and green buttons in the backlog is a strong indicator), several bad things may happen to your project: You lose the fast feedback loop between delivery and deployment. Developers will move on to the next story and may have already lost “context” about past ones. Unaccepted stories can not be deployed, so there’s less and later feedback about the feature in the full project.
- stories
- What makes a feature or a bug or a chore is worthy of an entire article on its own.


